
Demographics of Coventry
| Demographics of Coventry | |
|---|---|
 Population pyramid of Coventry | |
| Population | 316,960 (2011) |

Coventry, England is an ethnically and culturally diverse city. It is the fifteenth most populous city in the United Kingdom.

Population[edit]
Coventry's total population, according to the 2011 UK census, was 316,960. The population density was 3,408 people per square km.
Ethnicity[edit]


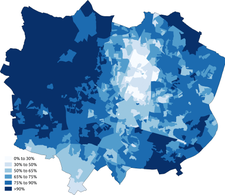
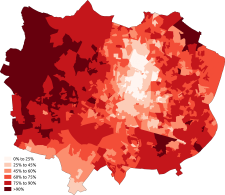
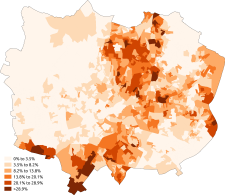
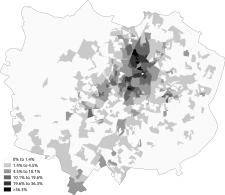
The following table shows the ethnic group of respondents in the 1991, 2001, 2011 and 2021 censuses in Coventry. Coventry has declined from a 88.1% White overall city to one with less than two-thirds of its population. Asian British people have risen from around 1 in 10 (9.7%) to around nearly 1 in 5 (18.5). Black British people have experienced an explosive growth, coming primarily from the increasing African population, they have risen from 1.6% to 8.9% from 1991 to 2021. The Mixed and Other ethnicities have also increased as well.
| Ethnic Group | 1971 estimations[1] | 1981 estimations[2] | 1991[3][4] | 2001[5] | 2011[6] | 2021[7] | ||||||
|---|---|---|---|---|---|---|---|---|---|---|---|---|
| Number | % | Number | % | Number | % | Number | % | Number | % | Number | % | |
| White: Total | 310,281 | 94% | 277,505 | 90.4% | 259,513 | 88.15% | 252,643 | 83.98% | 234,029 | 73.84% | 226,246 | 65.5% |
| White: British | – | – | – | – | – | – | 235,632 | 78.32% | 211,188 | 66.63% | 190,889 | 55.3% |
| White: Irish | – | – | – | – | 13,540 | 4.59% | 10,401 | 3.46% | 7,305 | 2.30% | 5,662 | 1.6% |
| White: Gypsy or Irish Traveller[note 1] | – | – | – | – | – | – | – | – | 151 | 0.05% | 294 | 0.1% |
| White: Roma | – | – | – | – | – | – | – | – | – | – | 1,116 | 0.3% |
| White: Other | – | – | – | – | – | – | 6,610 | 2.20% | 15,385 | 4.85% | 28,285 | 8.2% |
| Asian or Asian British: Total | – | – | – | – | 28,448 | 9.66% | 36,093 | 12.00% | 51,598 | 16.28% | 63,915 | 18.5% |
| Asian or Asian British: Indian | – | – | – | – | 21,562 | 7.32% | 24,177 | 8.04% | 27,751 | 8.76% | 32,096 | 9.3% |
| Asian or Asian British: Pakistani | – | – | – | – | 3,856 | 1.3% | 6,169 | 2.05% | 9,510 | 3.00% | 12,658 | 3.7% |
| Asian or Asian British: Bangladeshi | – | – | – | – | 1,201 | 0.4% | 1,741 | 0.58% | 2,951 | 0.93% | 4,257 | 1.2% |
| Asian or Asian British: Chinese[note 2] | – | – | – | – | 825 | 0.28% | 2,183 | 0.73% | 3,728 | 1.18% | 4,571 | 1.3% |
| Asian or Asian British: Other Asian | – | – | – | – | 1,004 | 0.34% | 1,823 | 0.61% | 7,658 | 2.42% | 10,333 | 3.0% |
| Black or Black British: Total | – | – | – | – | 4,822 | 1.63% | 5,412 | 1.80% | 17,764 | 5.60% | 30,723 | 8.9% |
| Black or Black British: African | – | – | – | – | 423 | 0.14% | 1,679 | 0.56% | 12,836 | 4.05% | 24,109 | 7.0% |
| Black or Black British: Caribbean | – | – | – | – | 3,288 | 1.11% | 3,314 | 1.10% | 3,317 | 1.05% | 3,459 | 1.0% |
| Black or Black British: Other Black | – | – | – | – | 1,111 | 0.37% | 419 | 0.14% | 1,611 | 0.51% | 3,155 | 0.9% |
| Mixed: Total | – | – | – | – | – | – | 5,163 | 1.72% | 8,230 | 2.60% | 11,731 | 3.4% |
| Mixed: White and Black Caribbean | – | – | – | – | – | – | 2,453 | 0.82% | 3,672 | 1.16% | 4,597 | 1.3% |
| Mixed: White and Black African | – | – | – | – | – | – | 271 | 0.09% | 943 | 0.30% | 1,663 | 0.5% |
| Mixed: White and Asian | – | – | – | – | – | – | 1,605 | 0.53% | 2,388 | 0.75% | 3,182 | 0.9% |
| Mixed: Other Mixed | – | – | – | – | – | – | 834 | 0.28% | 1,227 | 0.39% | 2,289 | 0.7% |
| Other: Total | – | – | – | – | 1,604 | 0.54% | 1,537 | 0.51% | 5,339 | 1.68% | 12,706 | 3.7% |
| Other: Arab[note 3] | – | – | – | – | – | – | – | – | 2,020 | 0.64% | 2,482 | 0.7% |
| Other: Any other ethnic group | – | – | – | – | 1,604 | 0.54% | 1,537 | 0.51% | 3,319 | 1.05% | 10,224 | 3.0% |
| Ethnic minority: Total | 19,968 | 6% | 29,494 | 9.6% | 34,874 | 11.85% | 48,205 | 16% | 82,931 | 26.2% | 119,075 | 34.5% |
| Total | 330,249 | 100% | 306,999 | 100% | 294,387 | 100% | 300,848 | 100% | 316,960 | 100% | 345,321 | 100% |
Notes for table above
-
 White
White -
 White-British
 -
 White-Irish
 -
 White-Other
 -
 Asian
Asian -
 Asian-Indian
 -
 Asian-Pakistani
 -
 Asian-Bangladeshi
 -
 Asian-Chinese
 -
 Black
Black -
 Black-African
 -
 Black-Caribbean
 -
 Other-Arab


Ethnicity of school pupils[8]
Coventry's schools are in a majority-minority state with no-overall ethnic majority present, however of broad multi-ethnic groups, Whites make up the majority with 54.3% of the population.
| Ethnic group | School year | |
|---|---|---|
| 2021/2022 | ||
| Number | % | |
| White: Total | 31,770 | 54.3 |
| White: British | 25,797 | 44.1 |
| White: Irish | 167 | 0.3 |
| White: Traveller of Irish heritage | 44 | 0.1 |
| White: Gypsy/Roma | 540 | 0.9 |
| White: Other | 5,222 | 8.9 |
| Asian / Asian British: Total | 12,780 | 22 |
| Asian / Asian British: Indian | 5,217 | 8.9 |
| Asian / Asian British: Pakistani | 3,072 | 5.3 |
| Asian / Asian British: Bangladeshi | 1,027 | 1.8 |
| Asian / Asian British: Chinese | 264 | 0.5 |
| Asian / Asian British: Other Asians | 3,200 | 5.5 |
| Black / Black British: Total | 7,733 | 13.2 |
| Black: Caribbean | 340 | 0.6 |
| Black: African | 6,683 | 11.4 |
| Black: Other Blacks | 710 | 1.2 |
| Mixed / British Mixed | 4,330 | 7.4 |
| Other: Total | 1,257 | 2.1 |
| Unclassified | 626 | 1.1 |
| Total: | 58,496 | 100.0 |
Languages[edit]
The most common main languages spoken in Coventry according to the 2011 census are shown below.[9]
| Rank | Language | Usual residents aged 3+ | Proportion |
|---|---|---|---|
| 1 | English | 261,117 | 86.14% |
| 2 | Punjabi | 6,849 | 2.26% |
| 3 | Polish | 6,161 | 2.03% |
| 4 | Gujarati | 2,523 | 0.83% |
| 5 | Urdu | 2,479 | 0.82% |
| 6 | Arabic | 1,821 | 0.60% |
| 7 | Tamil | 1,445 | 0.48% |
| 8 | Bengali (with Sylheti and Chatgaya) | 1,391 | 0.46% |
| 9 | French | 1,340 | 0.44% |
| 10 | Persian | 925 | 0.31% |
| 11 | Kurdish | 895 | 0.30% |
| 12 | Romanian | 883 | 0.29% |
| 13 | Hindi | 784 | 0.26% |
| 14 | Somali | 746 | 0.25% |
| 15 | Latvian | 674 | 0.22% |
| 16 | Russian | 597 | 0.20% |
| 17 | Swahili/Kiswahili | 572 | 0.19% |
| 18 | Shona | 521 | 0.17% |
| 19 | Slovak | 497 | 0.16% |
| 20 | Malayalam | 465 | 0.15% |
| Other | 10,445 | 3.45% |
Country of birth[edit]

Coventry's population is 27.9% foreign born as of 2021.
| Country of birth | Year | |
|---|---|---|
| 2021[10] | ||
| Number | % | |
| 248,990 | 72.1% | |
| Foreign born | 96,333 | 27.9% |
| Total | 345,323 | 100% |
Religion[edit]

The following table shows the religion of respondents in the 2001 and 2011 censuses in Coventry.
| Religion | 2001[11] | 2011[12] | 2021[13] | |||
|---|---|---|---|---|---|---|
| Number | % | Number | % | Number | % | |
| Christian | 196,346 | 65.26% | 170,090 | 53.66% | 151,577 | 43.9% |
| Buddhist | 784 | 0.26% | 1,067 | 0.34% | 1,257 | 0.4% |
| Hindu | 7,757 | 2.58% | 11,152 | 3.52% | 13,724 | 4.0% |
| Jewish | 222 | 0.07% | 210 | 0.07% | 259 | 0.1% |
| Muslim | 11,686 | 3.88% | 23,665 | 7.47% | 35,800 | 10.4% |
| Sikh | 13,960 | 4.64% | 15,912 | 5.02% | 17,297 | 5.0% |
| Other religion | 733 | 0.24% | 1,641 | 0.52% | 1,908 | 0.6% |
| No religion | 45,314 | 15.06% | 72,896 | 23.00% | 102,338 | 29.6% |
| Religion not stated | 24,046 | 7.99% | 20,327 | 6.41% | 21,166 | 6.1% |
| Total | 300,848 | 100.00% | 316,960 | 100.00% | 345,326 | 100% |
-
 Christianity
 -
 Islam
Islam -
 Judaism
 -
 Hinduism
 -
 Sikhism
 -
 Buddhism
 -
 Other religion
 -
 No religion


See also[edit]
- Demographics of the West Midlands
- Demographics of the United Kingdom
- Demographics of England
- Demographics of London
- Demographics of Birmingham
- Demographics of Greater Manchester
- List of English cities by population
- List of English districts by population
- List of English districts and their ethnic composition
- List of English districts by area
- List of English districts by population density
References[edit]
- ^ Jones, P. N. (1978). "The Distribution and Diffusion of the Coloured Population in England and Wales, 1961-71". Transactions of the Institute of British Geographers. 3 (4): 515–532. Bibcode:1978TrIBG...3..515J. doi:10.2307/622127. ISSN 0020-2754. JSTOR 622127. PMID 12157820.
- ^ Equality, Commission for Racial (1985). "Ethnic minorities in Britain: statistical information on the pattern of settlement". Commission for Racial Equality: Table 2.2.
- ^ Office of Population Censuses and Surveys; General Register Office for Scotland; Registrar General for Northern Ireland (1997): 1991 Census aggregate data. UK Data Service (Edition: 1997). DOI: http://dx.doi.org/10.5257/census/aggregate-1991-1 This information is licensed under the terms of the Open Government Licence
- ^ As UK Census data post 2001 is unavailable through the ONS website, it has been recommended to use archival census collection websites to obtain data. Data is taken from United Kingdom Casweb Data services of the United Kingdom 1991 Census on Ethnic Data for England. (Table 6)
- ^ "2001 census - theme tables". NOMIS. Retrieved 29 November 2015.
- ^ "Download:local authorities: county / unitary". NOMIS. Retrieved 29 November 2015.
- ^ "Ethnic group - Office for National Statistics". www.ons.gov.uk. Retrieved 2022-11-29.
- ^ "Schools, pupils and their characteristics, Academic Year 2021/22". explore-education-statistics.service.gov.uk. Retrieved 2022-11-28.
- ^ "Download:local authorities: county / unitary". NOMIS. Retrieved 29 November 2015.
- ^ "TS004 - Country of birth - Nomis - Official Census and Labour Market Statistics". www.nomisweb.co.uk. Retrieved 2023-04-22.
- ^ "2001 census - theme tables". Retrieved 29 November 2015.
- ^ "Download:local authorities: county / unitary". NOMIS. Retrieved 29 November 2015.
- ^ "Home - Office for National Statistics". www.ons.gov.uk. Retrieved 2022-12-05.