
Palmhurst, Texas
Palmhurst, Texas | |
|---|---|
 Location of Palmhurst, Texas | |
 | |
| Coordinates: 26°15′3″N 98°18′27″W / 26.25083°N 98.30750°W | |
| Country | |
| State | |
| County | |
| Area | |
| • Total | 4.45 sq mi (11.52 km2) |
| • Land | 4.45 sq mi (11.52 km2) |
| • Water | 0.00 sq mi (0.00 km2) |
| Elevation | 161 ft (49 m) |
| Population (2020) | |
| • Total | 2,601 |
| • Density | 614.48/sq mi (237.24/km2) |
| Time zone | UTC-6 (Central (CST)) |
| • Summer (DST) | UTC-5 (CDT) |
| ZIP code | 78573 |
| Area code | 956 |
| FIPS code | 48-54780[2] |
| GNIS feature ID | 1378825[3] |
| Website | cityofpalmhursttx |
Palmhurst is a city in Hidalgo County, Texas, United States. The population was 2,607 at the 2010 United States Census.[4] It is part of the McAllen–Edinburg–Mission and Reynosa–McAllen metropolitan areas.
History[edit]
The community was incorporated in 1966.
Geography[edit]
Palmhurst is located in southern Hidalgo County at 26°15′3″N 98°18′27″W / 26.25083°N 98.30750°W (26.250924, –98.307607).[5] It is bordered to the north by Alton, to the west by West Sharyland, to the south by Mission, and to the east by McAllen. Downtown McAllen is 8 miles (13 km) to the southeast, and the Rio Grande, the international border with Mexico, is 7 miles (11 km) to the south. Texas State Highway 107 is the main road through the city.
According to the United States Census Bureau, Palmhurst has a total area of 4.6 square miles (11.8 km2), all land.[4] The elevation is 160 feet (49 m) above sea level.
Demographics[edit]
| Census | Pop. | Note | %± |
|---|---|---|---|
| 1970 | 120 | — | |
| 1980 | 364 | 203.3% | |
| 1990 | 326 | −10.4% | |
| 2000 | 4,872 | 1,394.5% | |
| 2010 | 2,607 | −46.5% | |
| 2020 | 2,601 | −0.2% | |
| U.S. Decennial Census[6] | |||
2020 census[edit]
| Race | Number | Percentage |
|---|---|---|
| White (NH) | 402 | 15.46% |
| Black or African American (NH) | 11 | 0.42% |
| Native American or Alaska Native (NH) | 1 | 0.04% |
| Asian (NH) | 38 | 1.46% |
| Some Other Race (NH) | 2 | 0.08% |
| Mixed/Multi-Racial (NH) | 12 | 0.46% |
| Hispanic or Latino | 2,135 | 82.08% |
| Total | 2,601 |
As of the 2020 United States census, there were 2,601 people, 835 households, and 695 families residing in the city.
2000 census[edit]
As of the census[2] of 2000, there were 4,872 people, 1,226 households, and 1,110 families residing in the city. The population density was 804.0 inhabitants per square mile (310.4/km2). There were 1,739 housing units at an average density of 287.0 per square mile (110.8/km2). The racial makeup of the city was 84.67% White, 0.25% African American, 0.25% Native American, 0.39% Asian, 13.71% from other races, and 0.74% from two or more races. Hispanic or Latino of any race were 87.48% of the population.
There were 1,226 households, out of which 60.3% had children under the age of 18 living with them, 76.2% were married couples living together, 11.7% had a female householder with no husband present, and 9.4% were non-families. 7.3% of all households were made up of individuals, and 2.0% had someone living alone who was 65 years of age or older. The average household size was 3.97 and the average family size was 4.18.
In the city, the population was spread out, with 38.9% under the age of 18, 10.1% from 18 to 24, 29.5% from 25 to 44, 16.8% from 45 to 64, and 4.7% who were 65 years of age or older. The median age was 26 years. For every 100 females, there were 94.0 males. For every 100 females age 18 and over, there were 89.9 males.
The median income for a household in the city was $22,847, and the median income for a family was $24,549. Males had a median income of $27,500 versus $21,833 for females. The per capita income for the city was $11,275. About 35.6% of families and 37.9% of the population were below the poverty line, including 48.6% of those under age 18 and 20.4% of those age 65 or over.
However, over the past decade, the city lost nearly half its population as many low-income families in small homes moved out and were replaced by a smaller number of upscale residents. According to Onboard Informatics, by 2013 the median household income in Palmhurst had risen to $77,491, making it one of the wealthiest communities in South Texas. The demographics of Palmhurst have changed dramatically since 2000, as shown on the city-data.com website.
Education[edit]
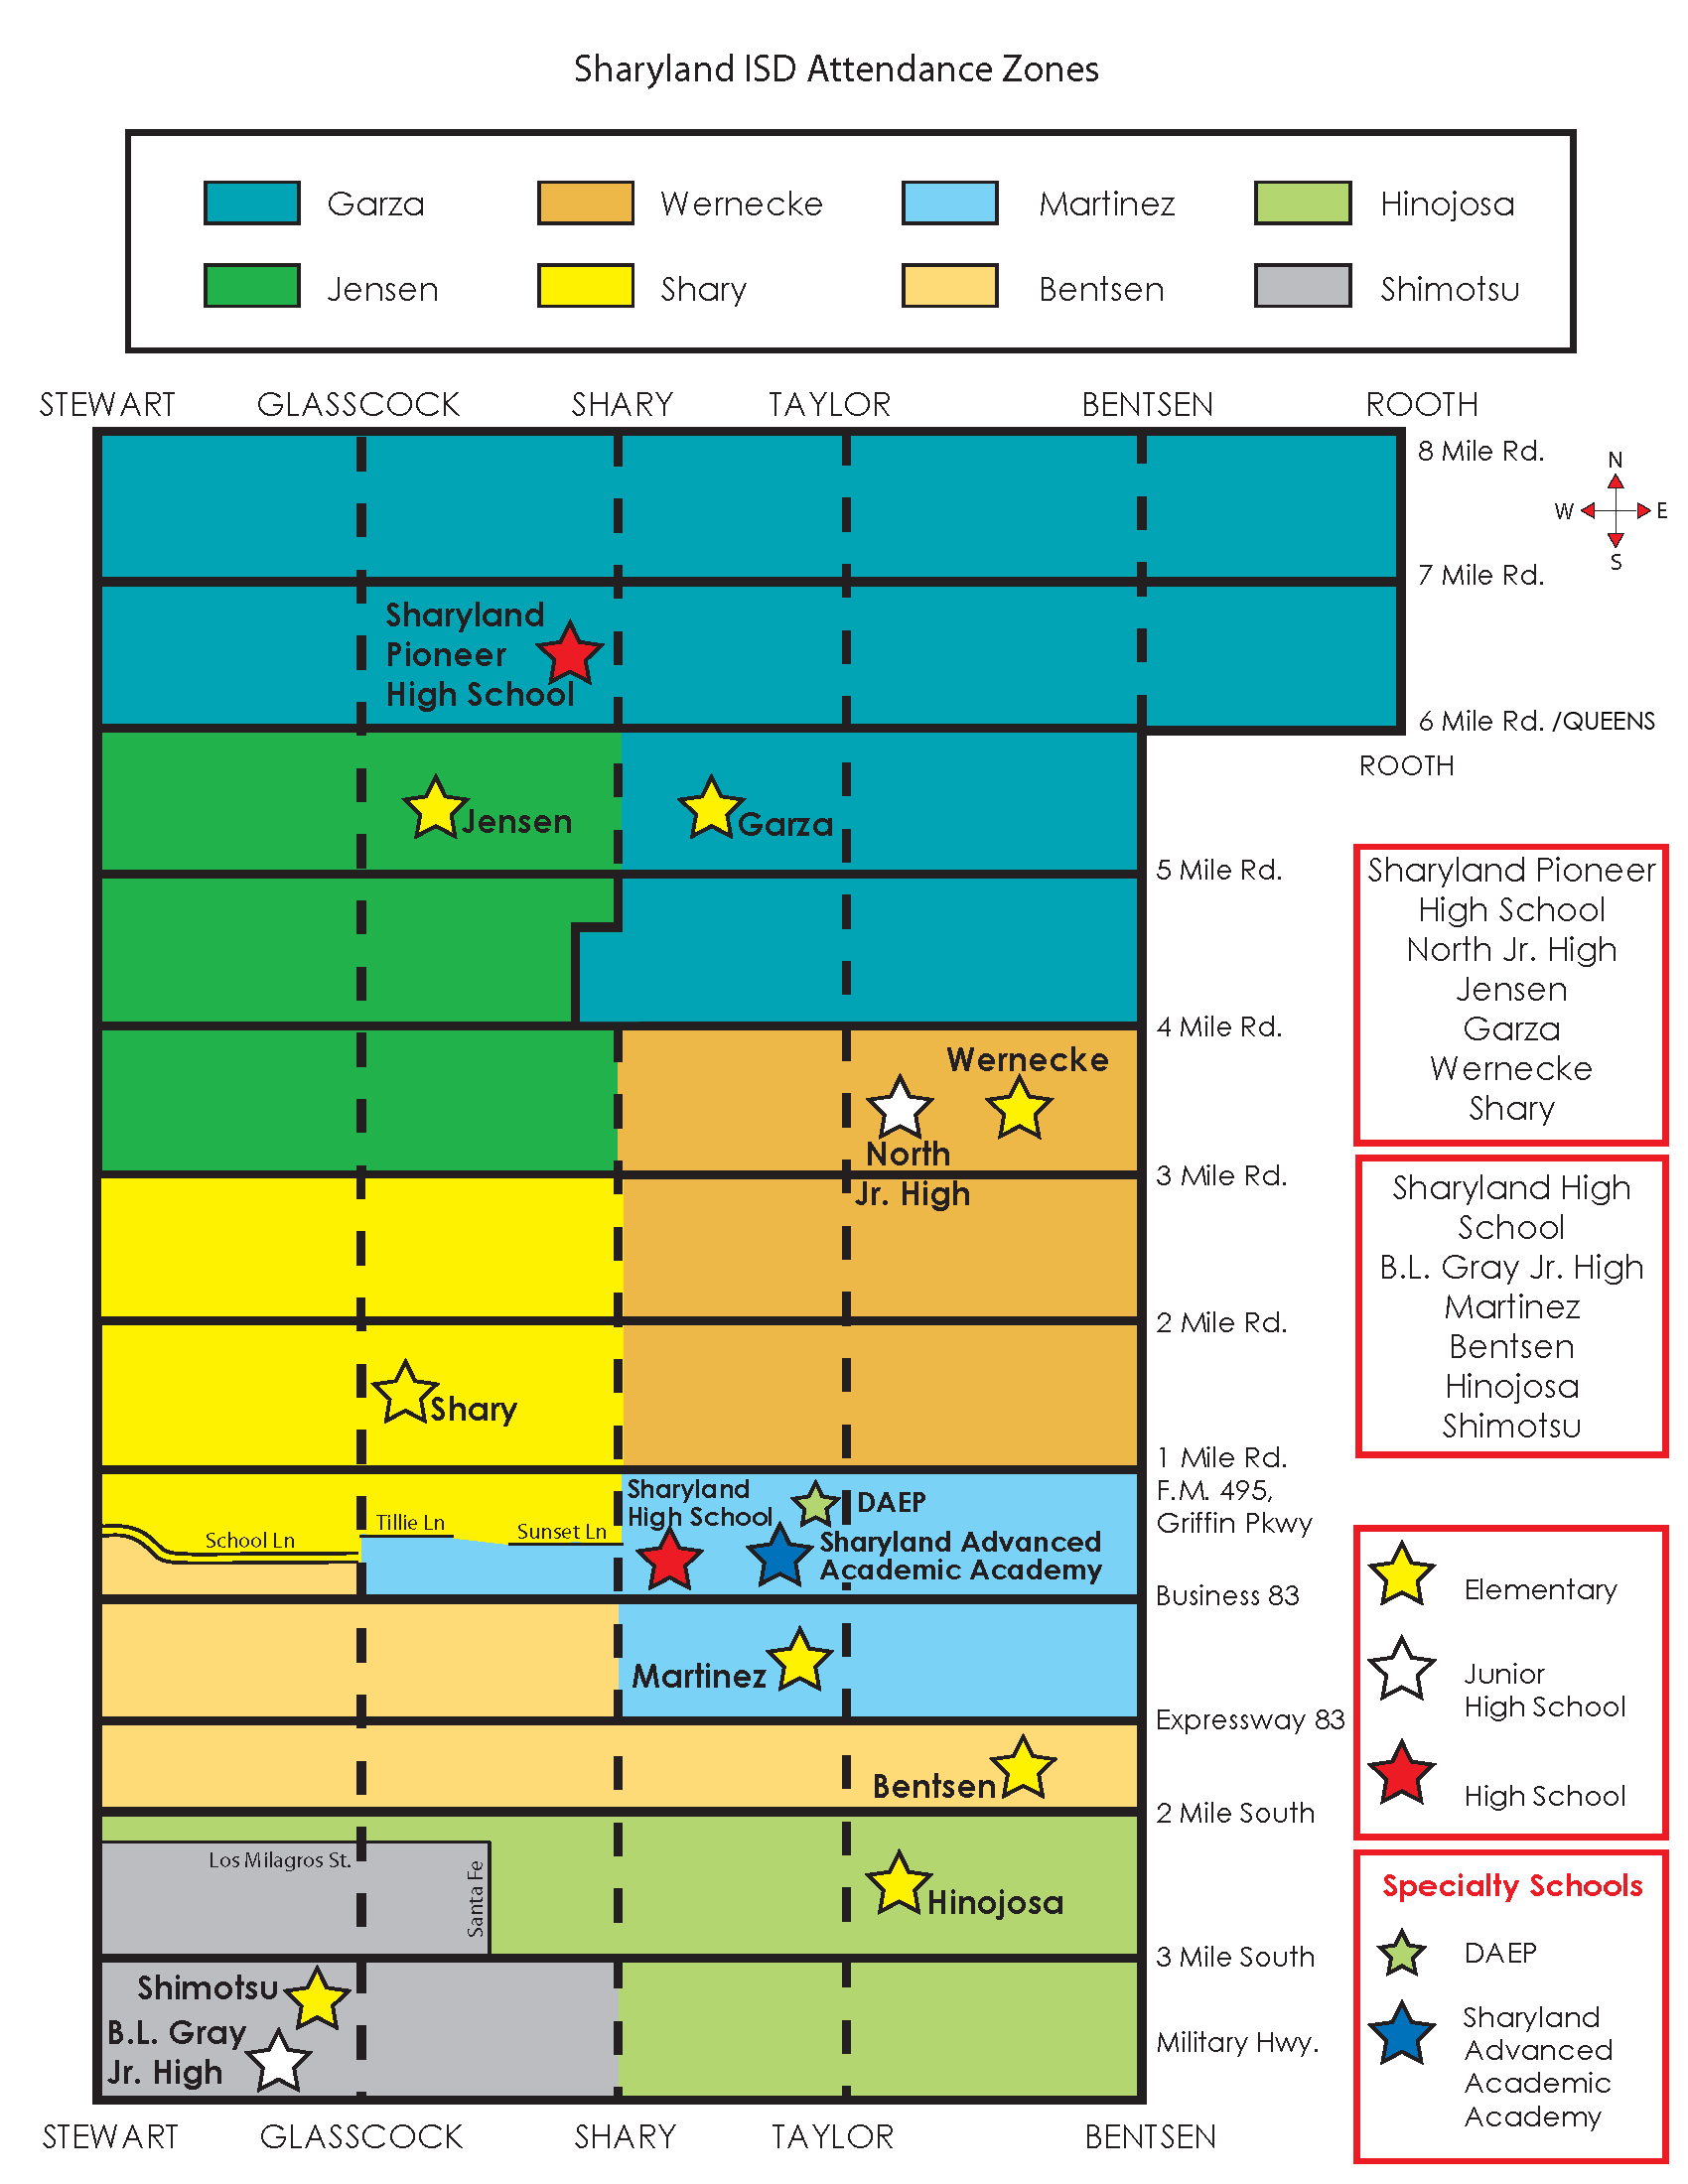
Much of Palmhurst is served by Mission Consolidated Independent School District. The eastern portion is served by the Sharyland Independent School District.[10][11]
Most of the Mission CISD part is zoned to Hurla M. Midkiff Elementary School in Palmhurst, while small sections are zoned to Waitz Elementary in Alton and Escobar/Rios Elementary in an unincorporated area. Students zoned to Midkiff are zoned to R. Cantu Junior High School in Palmhurst. Students zoned to Escobar/Rios and Waitz are zoned to Alton Memorial Junior High School in Alton. Sections of Palmhurst are zoned to Mission High School and Veterans Memorial High School in Mission.[12]
The Sharyland ISD section of Palmhurst is divided between John H. Shary Elementary School in Mission, Donna Wernecke Elementary School in McAllen, and Jessie L. Jensen Elementary School in Alton. All residents are zoned to North Junior High School in McAllen and Sharyland Pioneer High School in unincorporated Hidalgo County.[13]
In addition, South Texas Independent School District operates magnet schools that serve the community.
References[edit]
- ^ "2019 U.S. Gazetteer Files". United States Census Bureau. Retrieved August 7, 2020.
- ^ a b "U.S. Census website". United States Census Bureau. Retrieved January 31, 2008.
- ^ "US Board on Geographic Names". United States Geological Survey. October 25, 2007. Retrieved January 31, 2008.
- ^ a b "Geographic Identifiers: 2010 Census Summary File 1 (G001): Palmhurst city, Texas". American Factfinder. U.S. Census Bureau. Archived from the original on February 13, 2020. Retrieved February 16, 2018.
- ^ "US Gazetteer files: 2010, 2000, and 1990". United States Census Bureau. February 12, 2011. Retrieved April 23, 2011.
- ^ "Census of Population and Housing". Census.gov. Retrieved June 4, 2015.
- ^ "Explore Census Data". data.census.gov. Retrieved May 21, 2022.
- ^ https://www.census.gov/ [not specific enough to verify]
- ^ "About the Hispanic Population and its Origin". www.census.gov. Retrieved May 18, 2022.
- ^ "SCHOOL DISTRICT REFERENCE MAP (2010 CENSUS): Hidalgo County, TX." U.S. Census Bureau. Retrieved on August 2, 2018.
- ^ "2010 CENSUS - CENSUS BLOCK MAP (INDEX): Palmhurst city, TX" (map index). U.S. Census Bureau. Retrieved on August 2, 2018. Pages: 1 and 2.
- ^ "Mission CISD School Zones." Mission Consolidated Independent School District. Retrieved on August 2, 2018. See HTML version. Junior high boundaries are determined by the elementary school zoning, with some optional exceptions, while high school boundaries are described by text.
- ^ Attendance boundary map. Sharyland Independent School District. Retrieved on August 2, 2018. See also simplified map which also has a chart stating which elementary schools feed into which secondary schools.
External links[edit]
Municipalities and communities of Hidalgo County, Texas, United States | ||
|---|---|---|
| Cities |  | |
| CDPs |
| |
| Other community | ||