
Biological data visualization
Biological data visualization is a branch of bioinformatics concerned with the application of computer graphics, scientific visualization, and information visualization to different areas of the life sciences. This includes visualization of sequences, genomes, alignments, phylogenies, macromolecular structures, systems biology, microscopy, and magnetic resonance imaging data. Software tools used for visualizing biological data range from simple, standalone programs to complex, integrated systems.
An emerging trend is the blurring of boundaries between the visualization of 3D structures at atomic resolution, the visualization of larger complexes by cryo-electron microscopy, and the visualization of the location of proteins and complexes within whole cells and tissues.[1][2] There has also been an increase in the availability and importance of time-resolved data from systems biology, electron microscopy, and cell and tissue imaging.[3][4]
Sequence alignment[edit]
Sequence alignment is a fundamental technique in bioinformatics that plays a crucial role in comparing and analyzing genetic sequences to identify similarities, differences, conserved regions, sequence variations, and sequence motifs. By aligning sequences, researchers can figure out how closely two or more sequences (strings over an alphabet) are related to each other,[5] uncovering evolutionary relationships, functional domains, and genetic variations that provide valuable insights into the structure and function of genes and proteins.
In sequence alignments, conserved sequence regions represent areas of high similarity between sequences, indicating evolutionary conservation and potential functional significance. On the other hand, sequence variations highlight differences between sequences, which may be attributed to genetic mutations, polymorphisms, or evolutionary divergence. Sequence motifs, such as binding sites or functional domains, are short, conserved patterns within sequences that are essential for specific biological functions.
Sequence data visualization plays a crucial role in molecular biology research, allowing scientists to interpret and analyze complex genetic information in a meaningful way. By visually representing genomic data, researchers can identify patterns, variations, and relationships within sequences, leading to valuable insights and discoveries. Visualization tools such as genome browsers and comparative analysis software enable researchers to explore genetic data in a user-friendly and interactive manner, facilitating the understanding of genetic structures and functions.
Non-homologous exon alignment by an iterative method (a), and by a phylogeny-aware method (b).[citation needed]
To visualize sequence alignments and their features, researchers often rely on popular bioinformatics software tools such as Clustal Omega, MUSCLE, T-Coffee, and MAFFT. These tools provide interactive platforms for aligning sequences, highlighting conserved regions, displaying sequence variations, and identifying sequence motifs. Additionally, visualization software like Jalview, BioEdit, and Geneious offer advanced features for visualizing and analyzing sequence alignments, making it easier for researchers to interpret and extract meaningful information from genetic data.
Macromolecular[edit]
Visualizing macromolecules plays a pivotal role in comprehending the complex structures and functions inherent in biological systems. Advancements in 3D visualization of biological macromolecules, including carbohydrates, proteins, DNA, and RNA, have significantly progressed over the years. Enhanced techniques for visualizing macromolecules have greatly refined our views of complex biological data. They offer clarity and detail that deepen our grasp of how biological entities function and interact.
Techniques
Segmentation enhances biological imaging interpretation, with automated tools improving data analysis. This has led to a rise in web-based visualization for 3D segmentations. Segmentation plays a vital role in deciphering biological imaging data. The advent of sophisticated automated segmentation technologies, along with their incorporation into public imaging data repositories, greatly enhances the interpretation process.[6]
Volume rendering reveals internal macromolecular structures without segmentation, providing a non-invasive view inside the molecules.
Integrating experimental data into visualizations, like overlaying mutations or binding data, offers richer insights. This can be displayed as heat maps or gradients on the molecule, vital for managing the growing complexity of biomolecular data.[7]
Interactive 3D visualization offers hands-on engagement with macromolecules, allowing for manipulation such as rotation and zooming, which enhances comprehension.
Virtual reality and augmented reality present immersive methods to engage with macromolecules, delivering a 3D perspective that screen-based tools can't match. AR app also designed to help students visualize and interact with 3D macromolecular structures, addressing the limitations of traditional 2D images in conveying spatial details and depth perception.[8]
Animation of molecular activities illustrates the dynamic behaviors of biomolecules, serving as a powerful educational and research tool. Utilizing Unity3D game engine technology, this approach democratizes the creation of interactive molecular visualization tools, resulting in a user-friendly platform that simplifies complex biological data depiction.[9]
High-performance computing visualization enables real-time rendering of massive, intricate datasets, a necessity for advanced macromolecular analysis. Software leveraging high-performance computing dynamically and efficiently analyzes drug-receptor interactions via molecular dynamics simulations, offering profound insights and predictions on drug efficacy, and facilitating visualization.[10]
Hybrid visualization techniques merge various methods to provide a multifaceted view of molecules, combining detailed atomic positions with a holistic understanding of structure and volume.
Systems biology[edit]
Systems biology is a branch of biological data visualization dedicated to analyzing and modeling complex biological systems. Popular computational models used in systems biology include process calculi, such as stochastic π-calculus, and constraint-based reconstruction and analysis (COBRA), a paradigm that considers physical, enzymatic, and topological constraints underlying a phenotype in a metabolic network.[11][12]
One of the most popular classes of systems biology is metabolomics. Modern metabolomics imaging uses mass spectrometry to measure metabolite distribution information, then converts the peak intensity associated with the measurement point into an image.[13] Metabolic phenotypes can also be modeled and predicted with genome-scale models using COBRA methods, especially flux balance analysis.[14]
Popular software tools used in systems biology modeling include massPy, Cytosim, and PySB. Further examples may be found at Wikipedia's list of systems biology modeling software.
Magnetic resonance imaging[edit]
Magnetic resonance imaging (MRI) is a common form of biological data visualization used to form pictures of internal biological processes. Different settings of radiofrequency pulses and gradients result in different image appearances; these combinations are known as MRI sequences. A particularly notable subset of MRI is magnetic resonance angiography, which is a group of techniques used to image arteries and veins. MRI's imaging utility is further expanded upon by diffusion MRI and functional MRI, which can be used to capture neuronal tracts and blood flow respectively.
Diffusion MRI further relies on diffusion tensor imaging (DTI), which measures water molecule diffusion and directionality, and diffusion basis spectrum imaging (DBSI), which extracts multiple anisotropic and isotropic diffusion tensors.[15][16] Functional MRI relies on blood-oxygen-level dependent (BOLD) contrast, which measures the proportion of oxygenated hemoglobin in specific areas of the brain; this allows it to measure and model brain activity based on blood flow.[17] Further MRI techniques include saturation pulses (used to reduce motion artifacts), gradient echo (such as dynamic contrast enhancement), spin echo, and diffusion weighting (a signal contrast generation method based on differences in Brownian motion).[18][19][20]
Also of note are computed tomography (CT) and positron emission tomography (PET) scans, which are similar to MRI but rely on different imaging techniques (X-rays and ionizing radiation, respectively). Like MRI, CT scans use numerous methods to display and measure data, including sequential CT (where the CT table steps from location to location), spiral CT (where the entire X-ray tube is spun around the subject), and electron beam tomography (where only the electron paths are spun using deflection coils). PET scanners don’t have quite as much hardware variation and instead use different radiotracers depending on what the imaging target is. These two scanning techniques can also be combined using PET-CT scanners, which are used for the majority of modern PET scans. [21]
Alignment[edit]
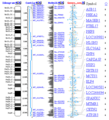
A sequence alignment is a way of arranging the sequences of protein, RNA or DNA, to identify regions of similarity that may be a consequence of functional, structural, or evolutionary relationships between the sequences. The concept initially compares only two such sequences in the so called pairwise alignment. Global alignments, which attempt to align every residue in every sequence, are most useful when the sequences in the query set are similar and of roughly equal size. Local alignments are more useful for dissimilar sequences that are suspected to contain regions of similarity or similar sequence motifs within their larger sequence context. Multiple sequence alignment is an extension of pairwise alignment to incorporate more than two sequences at a time. Multiple alignment methods try to align all the sequences in each query set. Multiple alignments are often used in identifying conserved sequence regions across a group of sequences hypothesized to be evolutionarily related.
Regular multiple sequence alignment – Aligned sequences of nucleotide or amino acid residues are typically represented as rows within a matrix. Gaps are inserted between the residues so that identical or similar characters are aligned in successive columns. Many sequence visualization programs also use color to display information about the properties of the individual sequence elements; in DNA and RNA sequences, this equates to assigning each nucleotide its own color. In protein alignments, such as the one in the image above, color is often used to indicate amino acid properties to aid in judging the conservation of a given amino acid substitution. For multiple sequences the last row in each column is often the consensus sequence determined by the alignment; the consensus sequence is also often represented in graphical format with a sequence logo in which the size of each nucleotide or amino acid letter corresponds to its degree of conservation.
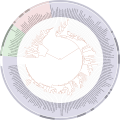
Circular multiple sequence alignment – A common assumption of multiple sequence alignment techniques is that the left- and right-most positions of the input sequences are relevant to the alignment. However, the position where a sequence starts or ends can be totally arbitrary. For instance, when linearizing a circular molecular structure, the start of the sequence is selected randomly. This is relevant, for instance, in the process of multiple sequence alignment of mitochondrial DNA, viroid, viral or other genomes, which have a circular molecular structure.
Spiral multiple sequence alignment – The geometry of the spiral sequence alignment is equivalent to a standard linear matrix, with the advantage that it summarizes very long sequences in a practical way.
3D visualization – The 1D-3D Group Alignment Viewer supports exploration of multiple sequence alignments (MSA) at sequence and structure levels for PDB experimental structures and computed structure models (CSMs). It is possible to select proteins and/or residue regions from the MSA to view their 3D structures aligned in Mol*. RCSB.org clusters protein entities (PDB experimental structures and CSMs) by sequence identity threshold and UniProt accession. For each cluster, the MSA is calculated using Clustal Omega and displayed in the 1D-3D Group Alignment Viewer using specific color schemes. PDB protein sequence positions are represented in blue if residue was experimentally determined, and in gray if not. CSMs are colored according to their local pLDDT scores.
Phylogenies[edit]
A phylogenetic tree is a branching diagram or a tree showing the evolutionary relationships among various biological species or other entities based upon similarities and differences in their physical or genetic characteristics. It is a visual representation that shows the evolutionary history between a set of species or taxa during a specific time. Two things are implicitly occurring along the branches of a phylogenetic tree. The first is the passage of time. Deeper nodes are older than the shallower nodes to which the are connected. Thus, deeper nodes indicate both more distant relationships among the terminal taxa that they connect, as well a greater age for the most recent common ancestor of those taxa. The second thing is evolutionary modification, or the accumulation of hereditary genetic and/or structural changes along branches. While these changes are often not shown (mapped) directly on the branches, it is these inferred changes that underpin the construction and interpretation of a phylogenetic tree. When systematists talk about "branch lengths", they are typically referring to the number of these changes. If the "branch lengths" of the tree measure these changes, we also call the tree a phylogram.
Regular phylogenetic tree – Generally called a dendrogram, it is a diagram with straight lines representing a tree.
Cladogram – It is also a diagram with straight lines representing a tree. A cladogram is not, however, an evolutionary tree because it does not show how ancestors are related to descendants, nor does it show how much they have changed, so many differing evolutionary trees can be consistent with the same cladogram.
Circular phylogenetic tree – Circular trees are often used to illustrate relationships among members of major groups of extant organisms, and these trees may have many terminal taxa.
3D Visualization – In a phylogram, we represent the evolutionary distance on one of the axes and the genes on the other. If we would also like to visualize the paralogs, we can add one third axis.
Visualization software[edit]
| Name | Description | Data type | Author(s) | Year |
|---|---|---|---|---|
| Cytoscape | Open source software platform for visualizing complex biological networks[22] | Systems biology | Cytoscape Team | July 2002 |
| FigTree | Java tree viewer able to read multiple tree file formats, color branches, and produce vector artwork | Phylogenetic tree | Andrew Rambaut | Nov 6, 2006 |
| Interactive Tree Of Life (ITOL) | Constructs trees and annotates them with various types of data | Phylogenetic tree | Ciccarelli FD, et al. [23] | Mar 3, 2006 |
| Jmol | Free, open-source java applet capable of loading multiple molecules with independent movement, surfaces and molecular orbitals, cavity visualization, and crystal symmetry[24] | Molecular | Dan Gezelter | 2001 |
| Medical Image Processing, Analysis, and Visualization (MIPAV) | Quantitative analysis and visualization of medical images for modalities such as PET, MRI, CT, or microscopy[25] | Medical imaging | National Institutes of Health Center for Information Technology | Unknown |
| Medusa | Software to build and analyze ensembles of genome-scale metabolic network reconstructions[26] | Systems biology | Gregory L. Medlock, Thomas J. Moutinho, Jason A. Papin | 2001 |
| Molecular Evolutionary Genetics Analysis (MEGA) | Provides multiple algorithms to construct phylogenetic trees, including UPGMA, Maximum Likelihood, Maximum Parsimony, etc | Phylogenetic tree | Masatoshi Nei, Sudhir Kumar, Koichiro Tamura, Glen Stecher, Daniel Peterson, Nicholas Peterson | 1993 |
| Molecular Operating Environment (MOE) | Models micro- and macromolecules, protein-ligand complexes, and crystal lattices | Molecular | Chemical Computing Group | Unknown |
| PyMOL | Open-source Python application for modeling biological macromolecules | Molecular | Warren Delano | 2017 |
-
 Visual representation of a genome
 -
 ITOL tree of life
 -
 Signal transduction chart
 -
 Molecular visualization
 -
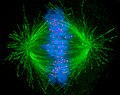 Visualization of a human cell undergoing mitosis
 -
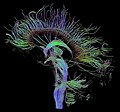 Sagittal fibers pictured using diffusion tensor imaging (DTI)


References[edit]
- ^ Lucić V, Förster F, Baumeister W (2005). "Structural studies by electron tomography: from cells to molecules". Annual Review of Biochemistry. 74: 833–65. doi:10.1146/annurev.biochem.73.011303.074112. PMID 15952904.
- ^ Steven AC, Baumeister W (September 2008). "The future is hybrid". Journal of Structural Biology. 163 (3): 186–95. doi:10.1016/j.jsb.2008.06.002. PMID 18602011. S2CID 2432954.
- ^ Plattner H, Hentschel J (2006). "Sub-Second Cellular Dynamics: Time-Resolved Electron Microscopy and Functional Correlation". A Survey of Cell Biology (Submitted manuscript). International Review of Cytology. Vol. 255. pp. 133–76. doi:10.1016/S0074-7696(06)55003-X. ISBN 9780123735997. PMID 17178466.
- ^ Frank J, Schlichting I (September 2004). "Time-resolved imaging of macromolecular processes and interactions". Journal of Structural Biology. 147 (3): 209–10. doi:10.1016/j.jsb.2004.06.003. PMID 15450290.
- ^ Apostolico, A., & Giancarlo, R. (1998). Sequence alignment in molecular biology. Journal of Computational Biology, 5(2), 173-196.
- ^ Chareshneu, A; Midlik, A; Ionescu, C. M. (2023). "Mol* Volumes and Segmentations: visualization and interpretation of cell imaging data alongside macromolecular structure data and biological annotations". Nucleic Acids Research. 51(W1): W326-W330.
- ^ Sehnal, D (2021). "High-performance macromolecular data delivery and visualization for the web. Corrigendum" (PDF). Acta crystallographica. Section D, Structural biology. 77(1): 126-126.
- ^ Sung, R. J. (2019). "BiochemAR: An augmented reality educational tool for teaching macromolecular structure and function". Journal of chemical education. 97(1): 147-153.
- ^ Werner, E (2022). "Strategies for the Production of Molecular Animations". Frontiers in Bioinformatics. 2: 793914.
- ^ Pieroni, M (2023). "MD–Ligand–Receptor: A High-Performance Computing Tool for Characterizing Ligand–Receptor Binding Interactions in Molecular Dynamics Trajectories". . International Journal of Molecular Sciences. 24(14): 11671.
- ^ Ananiadou, Sophia (October 12, 2006). "Text mining and its potential applications in systems biology". National Library of Medicine. Trends in Biotechnology. Retrieved April 14, 2024.
- ^ Resendis-Antonio, Osbaldo. "Constraint-based Modeling". Springer. Springer Nature. Retrieved April 14, 2024.
- ^ "Imaging Metabolomics". Shimadzu. Retrieved April 15, 2024.
- ^ Orth, Jeffrey D (March 28, 2010). "What is flux balance analysis?". National Library of Medicine. Nature Biotechnology. Retrieved April 14, 2024.
- ^ Weber, B. (2009). "Magnetic Resonance Imaging in Epilepsy Research: Recent and Upcoming Developments". Science Direct. Encyclopedia of Basic Epilepsy Research. Retrieved April 14, 2024.
- ^ Wooliscroft, Lindsey (April 2024). "Diffusion basis spectrum imaging and diffusion tensor imaging predict persistent black hole formation in multiple sclerosis". Multiple Sclerosis and Related Disorders. Elsevier. Retrieved April 14, 2024.
- ^ Vincent, K. (December 12, 2008). "Blood oxygenation level dependent functional magnetic resonance imaging: current and potential uses in obstetrics and gynaecology". National Library of Medicine. An International Journal of Obstetrics and Gynaecology. Retrieved April 14, 2024.
- ^ "How do saturation pulses work?". Questions and Answers in MRI. Elster LLC. Retrieved April 14, 2024.
- ^ Cha, Soonmee (2013). "Dynamic Functional and Physiological Techniques". Science Direct. Imaging of the Brain. Retrieved April 14, 2024.
- ^ Cha, Soonmee (September 28, 2016). "Diffusion weighted imaging: Technique and applications". National Library of Medicine. Baishideng Publishing Group Inc. Retrieved April 14, 2024.
- ^ "PET/CT". RadiologyInfo.org. Radiological Society of North America, Inc. May 1, 2023. Retrieved April 14, 2024.
- ^ "Cytoscape". Cytoscape. Cytoscape Consortium. Retrieved April 16, 2024.
- ^ "ITOL Interactive Tree Of Life". ITOL. Nucleic Acids Research. April 13, 2024. Retrieved April 16, 2024.
- ^ Maqsood, Muneeza (October 11, 2020). "Biological Data Analysis & Visualization". BioCode. BioCode Ltd. Retrieved April 16, 2024.
- ^ "About MIPAV". ITOL. Center for Information Technology. April 13, 2024. Retrieved April 16, 2024.
- ^ "Medusa: Software to build and analyze ensembles of genome-scale metabolic network reconstructions". National Library of Medicine. PLoS Comput Biol. April 29, 2020. Retrieved April 16, 2024.
External links[edit]
Related conferences[edit]
- BioVis: Symposium on Biological Data Visualization
- Applications of Information Visualization in Bioinformatics
- CIBDV: Computational Intelligence for Biological Data Visualization
- IVBI: Information Visualization in Biomedical Informatics Symposium
- VMLS: Visualization in Medicine & Life Sciences
- VIZBI: Workshop on Visualizing Biological Data